
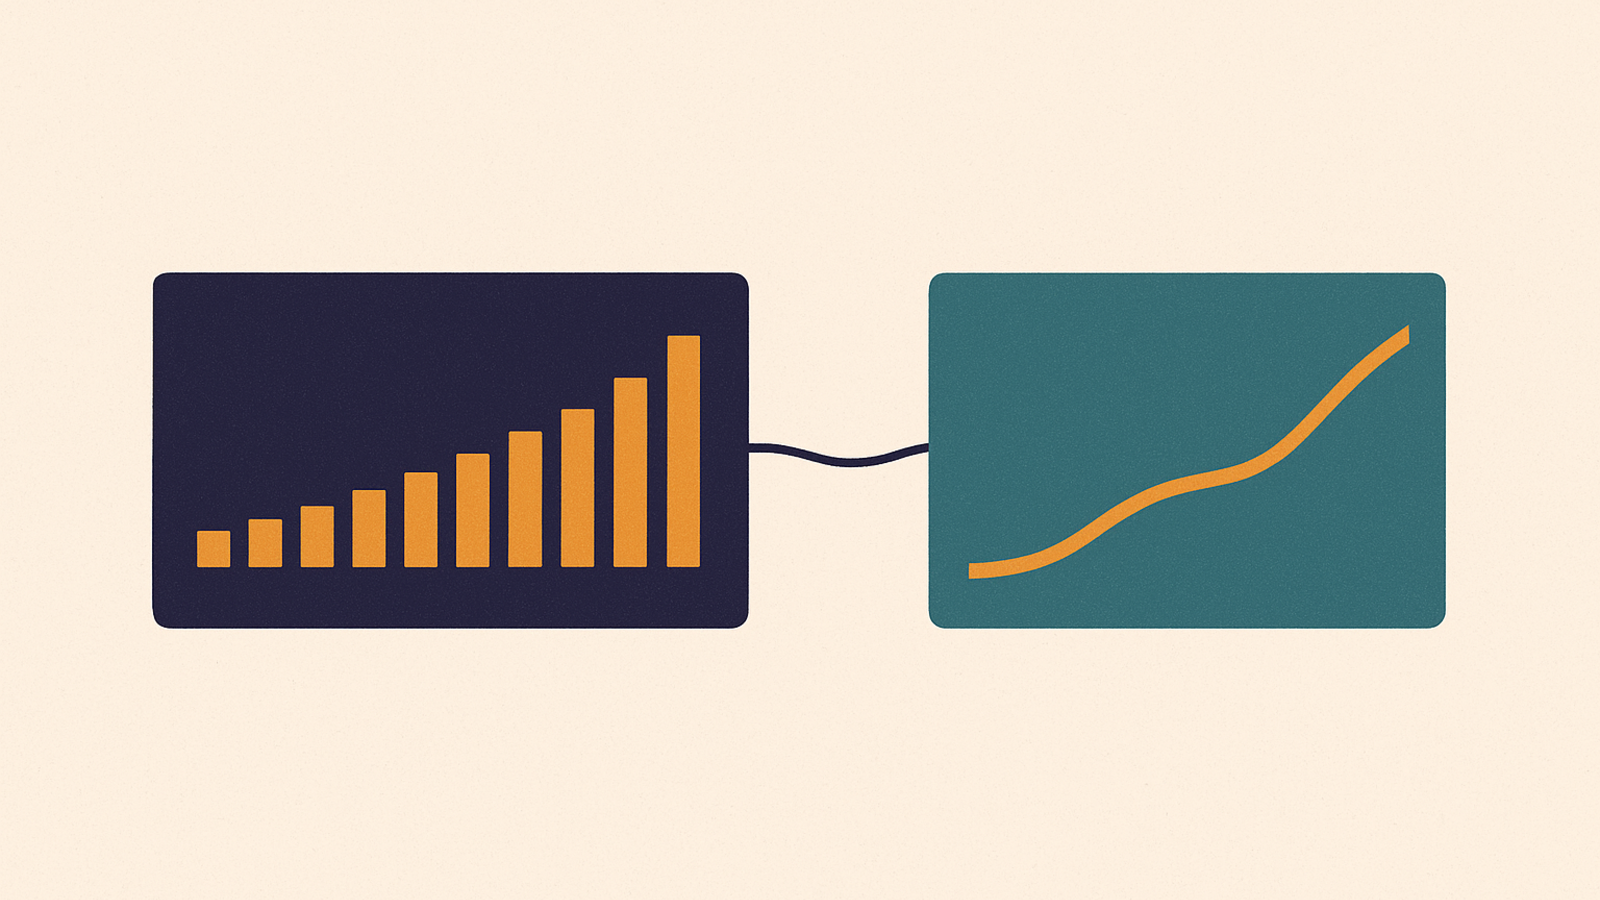


When a client asks «how are we doing?» they are actually asking two different questions: did the content we published work? and is the account growing? Two questions with different time horizons, different units of measurement and different operational consequences. If they end up in the same table, the report becomes unreadable: one Reel that did well papers over a month of stagnant follower numbers, or a flat week of growth makes a carousel look useless when in fact it drove saves and shares.
The good news is that the platforms themselves are pushing in this direction. As HeyOrca reports in its guide to Instagram's 2026 updates, Instagram has updated its performance indicators to include audience growth, and the platform's own guidance on follower growth points to Reels and carousels as the formats that reach new people. Translated into practice: the distinction between «did the content work» and «is the profile growing» is no longer a stylistic choice made by whoever writes the reports. It's the structure the platform itself is suggesting.
Report 1 — Content performance: what each published piece did
This report looks at individual posts and compares them with each other. The unit of analysis is the content, not the month. Its job is to help you decide what to produce next week.
Three rules to make it useful:
- Compare formats with formats. A Reel and a static feed post aren't playing in the same league. Line up Reels with Reels, carousels with carousels, statics with statics, and then look at which group pulls hardest on that specific profile.
- Compare networks with networks, not a post with «its twin». The same visual published on Instagram, LinkedIn and TikTok isn't the same content: the crop changes, the cover changes, the audience changes. If your editor shows you a per-network preview before publishing, you already have the proof that those three posts are different objects — and they need to be read as such after the fact too.
- Note down the why, not just the number. Three lines of notes on what you tried (a different hook, a different cover, the link in the first comment) are worth more than one extra column of metrics.
There's one more reason, today, not to make feed placement the central variable. As Metricool points out in its update tracker, Instagram is testing an app that opens straight into Reels, along with a customisable «Your Feeds» hub — with the option, Metricool reports, of choosing between Following, Friends, Latest, Saved, Favorites and Suggested — and it has extended the preferred-topic controls of the «Your Algorithm» feature to the main feed. If the surface a post lands on depends on how the user has configured their own app, the performance of a single static becomes less predictable. So the content report has to think in terms of format groups over time, not in terms of one lucky shot.

Report 2 — Account growth: what's happening to the profile
Here the unit of analysis is the period. Net followers, the trend, and — above all — the relationship with the mix you published. Two precautions that change everything:
Long windows, not weekly ones
Growth has an extremely high background noise on a weekly basis. A growth report read every seven days produces hysterical decisions: you change strategy because on Monday twelve followers came in instead of twenty. Fix a window (a month, or four weeks) and compare it with the previous one. Format decisions are made on that cadence, not on the cadence of the individual post.
Put the mix next to the curve, not the individual posts
The right question isn't «which post brought in followers», it's «when I published more Reels and carousels, did the curve move?». That's exactly the angle suggested by the Instagram guidance HeyOrca cites: Reels and carousels as the formats that reach new audiences. If your calendar that month was 80% static, you already have an answer and an action, with no need for impossible attribution.
How the two reports talk to each other (without merging)
The link is the format mix, and it lives in the content calendar. The healthy workflow is this:
- The content report tells you which format performs on this profile.
- The growth report tells you whether the audience is expanding.
- Next month's calendar shifts the weights: more Reels, more carousels, fewer filler statics — or the opposite, if that's what the data says.
- The month after, you read growth again and check whether shifting the weights had an effect.
It's the only loop that really closes. And it's also the point where production enters the conversation: if you decide to increase the weight of carousels on TikTok too, bear in mind that — as SocialBee's update tracker records — TikTok now lets you create photo posts from desktop web. For anyone assembling statics and carousels inside a broader calendar, instead of shooting everything in-app on their phone, that's one less item to handle outside the main workflow.

Data hygiene: three things that skew the comparison
1. Posts that never went out. A piece of content in error, or left as «not approved», isn't content that performed badly: it's content that doesn't exist. If your tool keeps the states visible (draft, scheduled, published, not approved, error, with an automatic retry when the network call fails), the count of «how much we actually published» is a fact, not an estimate. Without it, the denominator of your report is made up.
2. Content edited after publishing. As reported by The Gain Blog, Instagram lets creators replace the in-app audio of a post or carousel that's already published: a track that no longer works can be swapped without deleting and re-uploading. Handy, but it has a consequence for reporting: «published» is no longer an entirely final state, and the asset you see in your scheduler may not match what's live. If you swap an audio track, write it in the post's notes: otherwise, a month later you'll be comparing two different pieces of content believing they're the same one.
3. A change in seasonality or publishing rhythm. If one month you published twelve posts and the next twenty-four, the totals aren't comparable. Always report the number of published pieces too, in both reports.
How I set this up in Pubblie
The concrete part, inside the product, is simpler than it sounds, because Pubblie already keeps the two readings separate: analytics cover published content on one side and account growth on the other. Here's how I use it:
- A weekly read on content, inside the calendar: I look at the week's published posts, group them by format and by network, and decide next week's content.
- A monthly read on growth, never together with the first one. Next to it I put the format mix that actually went out that month — which I read off the calendar, not from memory.
- Client access, decided per project. The customer role is there to review the content of the projects they've been added to, leave notes and approve or reject; for each project the owner decides whether they can also see channels and analytics. For a client who wants to look at the numbers on their own, this avoids the PDF report that arrives too late. For a client who doesn't want them, it avoids the noise.
- Export for anyone with their own dashboard. If the final report lives elsewhere, the public API and the MCP server are there to get the data out without copying it by hand.
The checklist to keep on the desk
- Two files (or two sections), not one: content and growth.
- The content report compares format with format and network with network.
- The growth report is read on monthly windows and comes with the published mix.
- Reels and carousels have an explicit weight in the calendar, not a leftover one.
- The number of posts actually published appears in both reports.
- Every post-publication edit (audio included) is noted on the post.
The benefit isn't cosmetic. When the two reports are separate, every client meeting has two different, useful conclusions: what we produce and whether we're expanding the audience. Mixed together, they produce only one — and almost always the wrong one.